

Clinical Program ROI: Measuring What Your PBM Claims to Deliver
A six-program evaluation scorecard with verification methodology that separates real savings from reported savings

To verify a PBM’s clinical program savings, request the specific savings methodology and a reproducible sample calculation for each program, then score every program on clinical appropriateness, financial methodology, member experience, and independent verifiability; a PBM that cannot show the math is reporting a marketing number, not a verified dollar saved.
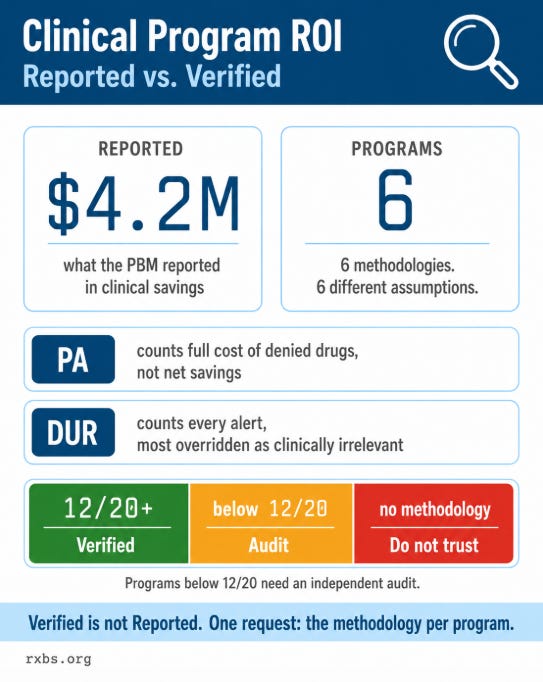
A PBM presented a client with a report showing $4.2 million in “clinical savings” from six programs. The client was impressed. I was skeptical. When we audited the methodology, the verified savings were a fraction of that number. The PBM’s calculation counted avoided costs that were never going to occur and credited formulary-driven savings to clinical intervention programs that had nothing to do with the outcome.
Illustrative example for educational purposes. Actual amounts vary by plan.
By the end of this piece you will have the evaluation scorecard we use in audits: six programs, four scoring dimensions each, the thresholds that tell you which programs need an independent audit, and the four data requests that make scoring possible in the first place.
I share this not to dismiss PBM clinical programs. Some are genuinely valuable. Prior authorization prevents inappropriate utilization. Step therapy ensures cost-effective alternatives are tried first. Drug utilization review catches dangerous interactions. These are real clinical functions with real value.
The problem is measurement. PBMs report savings using methodologies they designed, applied to their own data, with no independent verification. The employer sees a headline number. The methodology behind that number is rarely shared. And when it is shared, the assumptions often do not hold up under scrutiny.
As a pharmacist, I believe in clinical programs. As a consultant who reviews hundreds of contracts a year, I believe in verifying the numbers. At Prescription Benefit Solutions, this verification work is a standard part of how our firm audits a plan’s pharmacy spend.
Six programs, six methodologies, six questions
Most PBMs report savings from the same core programs. Here is what each program claims, how the savings are typically calculated, and where the methodology breaks down.
Program 1: Prior Authorization
What the PBM claims: PA prevents inappropriate utilization, saving the plan the cost of drugs that should not have been approved. How savings are calculated: Denied claims multiplied by the cost of the denied drug. If PA denied 500 claims at $1,000 each, reported savings = $500,000. Where it breaks down: Not every denied claim would have been filled without PA. Many PA denials result in an alternative drug that also costs the plan money. The net savings is the cost difference between the denied drug and the alternative, not the full cost of the denied drug. Also, PA that is too restrictive delays appropriate therapy, which has its own cost.
Program 2: Step Therapy
What the PBM claims: Step therapy ensures members try cost-effective alternatives before expensive options. Typical calculation: Members who used the step therapy drug instead of the target drug, multiplied by the cost difference. Where it breaks down: If the member would have been prescribed the step therapy drug regardless of the protocol, the program gets credit for savings it did not create. The counterfactual assumption (what would have happened without the program) is almost always overstated.
Program 3: Quantity Limits
What the PBM claims: Quantity limits prevent excessive fills and waste. Typical calculation: Excess quantity prevented multiplied by cost per unit. Where it breaks down: Quantity limits aligned with clinical guidelines are appropriate. Quantity limits that restrict access below clinical standards create adherence problems. The savings calculation rarely accounts for downstream medical costs from undertreated conditions.
Program 4: Drug Utilization Review (DUR)
What the PBM claims: DUR catches therapeutic duplications, drug interactions, and inappropriate combinations. Typical calculation: Interventions made multiplied by assumed cost avoidance per intervention. Where it breaks down: Most DUR alerts are overridden by pharmacists because they are clinically irrelevant (the prescriber already considered the interaction). Counting every alert as a “savings event” inflates the numbers dramatically.
Program 5: Medication Therapy Management (MTM)
What the PBM claims: MTM reviews identify medication problems and optimize therapy. Typical calculation: Cost avoidance from medication changes recommended during MTM consultations. Where it breaks down: MTM completion rates are often low. Many recommendations are not implemented. Attributing savings to a recommendation that was made but not followed is not a real savings event.
Program 6: Specialty Management
What the PBM claims: Specialty management programs optimize high-cost therapy through site-of-care steering, biosimilar conversion, and clinical pathway management. Typical calculation: Cost difference between actual utilization and projected utilization without the program. Where it breaks down: The projected counterfactual (what would have happened without the program) is constructed by the PBM. If the projection assumes high utilization growth and actual growth was lower, the program claims credit for savings that may have occurred naturally.
The clinical program evaluation scorecard
For each of the six programs, score on four dimensions (1-5 each):
Clinical appropriateness (1-5).
Does the program apply evidence-based criteria? Are the protocols aligned with current clinical guidelines? Does it account for individual patient factors?
Financial impact methodology (1-5).
Can the PBM provide the specific calculation? Is the counterfactual assumption reasonable? Can you reproduce the math independently?
Member experience impact (1-5).
Does the program create access barriers or delays? What is the therapy abandonment rate? Are members negatively affected by administrative requirements?
Independent verifiability (1-5).
Can the reported savings be audited by an independent party? Does your contract give you audit rights over clinical program reporting? Can you request the underlying data?
Scoring: Each program scores 4-20. Programs scoring below 12 need independent audit. Programs scoring below 8 may be costing the plan more in administrative burden and access delays than they save.
Total across six programs: 24-120. Below 48: clinical program suite needs substantial overhaul. 48-84: mixed results, focus on lowest-scoring programs. Above 84: strong clinical program infrastructure.
The four data requests that enable scoring
The scorecard only works if you can fill it in, and every dimension above depends on data the PBM already holds and does not send by default. Four requests per program cover it.
1. The savings methodology, with one worked sample calculation.
Not the description of the program. The arithmetic: the baseline, the counterfactual, any multiplier, and the source of each input. A methodology that cannot survive being written out on a single page is itself the finding.
2. The raw data behind the claim, not the summary.
Claim-level detail for the population the program touched. A summary table is the PBM’s aggregation of its own assumptions. The underlying file is what lets you reproduce the number, or fail to.
3. The intervention rate.
Of the members eligible for the program, what percentage were actually affected by it. A program credited with plan-wide savings that reached a small slice of the eligible population is being measured against the wrong denominator.
4. The outcome rate.
Of the members the program did affect, what percentage had a measurable result: a therapy changed, a fill avoided, a lower-cost alternative dispensed. This is the request that separates DUR alerts fired from prescriber behavior changed, and MTM consultations scheduled from recommendations actually implemented.
One follow-up is worth adding wherever the program creates a process a member has to complete, which means step therapy, prior authorization, and most specialty management: ask for the therapy abandonment rate. If members who need a medication give up partway through the process, the savings report books a win and the plan absorbs the downstream cost in a different budget line, where nobody connects it back. A savings number without an abandonment number is half a report.
Your broker or consultant can help interpret the data. The best advisory teams are already requesting this level of detail. If yours has not, share this scorecard with them. For how this clinical-program verification fits inside a full contract audit, see our Contract Review Readiness Checklist.
Have you audited your PBM's clinical program savings? Leave a comment below.
For the full protective contract language on prior authorization and clinical program provisions, see our free PBM Contract Language Library: https://www.rxbs.org/contract-language-library. Updated quarterly from patterns we see in client contract reviews.
Questions? team@rxbs.org. Subscribe to Benefit Blind Spots.